The strongest El Niño on record may be forming
The Pacific is already warmer than at this point in 1997 or 2015. What past giants did to California’s rain, and what it means at home.
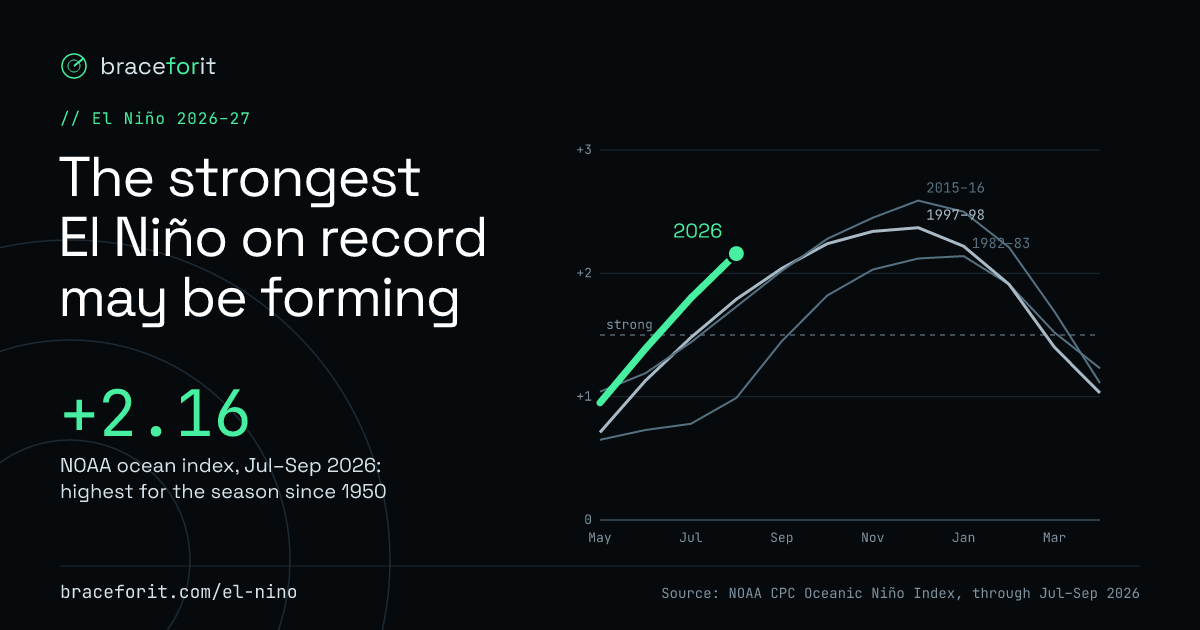
Ahead of every big El Niño at this point in the year
Ocean index · °C above normalFebruary 1998 alone brought 9.95 in to Sacramento and 13.68 in to Los Angeles.
NOAA CPC Oceanic Niño Index, through Jul–Sep 2026 · pulled Oct 20, 2026
What El Niño is
Every few years the surface of the tropical Pacific warms by a few degrees. In winter that warm water tends to push the jet stream south over the United States, aiming storm after storm at California and the southern states. NOAA measures its strength by how much warmer than normal that stretch of ocean is: above +1.5 °C is strong, above +2.0 °C very strong.
- +2.16
- NOAA’s El Niño index for Jul–Sep 2026: the highest for that time of year since records began in 1950. 1997 was +1.79, 2015 +1.73.
- 83%
- NOAA’s odds (Oct 8) that Oct–Dec reaches +2.5 °C on its newer relative index. NOAA says that would exceed every El Niño since 1950.
- Wetter
- NOAA’s winter outlook (Oct 15) leans wetter than normal for Dec–Feb across California, with the highest odds in the south, and across the southern US.
What strong El Niños did to California rain
Oct–Sep rain · % of normalThe two giants, 1982–83 and 1997–98, brought Sacramento 190% and 176% of its normal rain and more than doubled Los Angeles’s (233% and 215%). Not every strong El Niño delivered.
Bars run from 0 to 250% of normal. Strong = NOAA index peak of +1.5 or more (9 El Niños since 1950). 1982–83 was Sacramento’s wettest water year since 1950 in these records; 1997–98 its third wettest.
NOAA ACIS monthly rain, water years Oct–Sep 1950–2026; normal = 1991–2020 · pulled Oct 20, 2026
How a big El Niño winter builds
Rain since Oct 1 · inchesRain adds up month by month from October. In a normal year most of it falls December through March. In the big El Niño winters the line keeps climbing long after a normal year flattens out.
In 1982–83, Sacramento passed a normal year’s total rain during February, with spring still to come. In 2015–16 it never caught up to normal.
NOAA ACIS monthly rain, water years Oct–Sep 1950–2026; normal = 1991–2020 · pulled Oct 20, 2026
What this means for your household
El Niño winters tend to send storm after storm. Once the soil is soaked, each new storm runs off faster into streets and creeks, and trees in soaked ground fall more easily, taking power lines with them.
Sacramento’s wettest months are normally Dec–Feb. In 1982–83 and 1997–98 it got more rain after January 1 (22.9 and 23.7 in) than a normal year brings in total (18.1 in). February 1998 alone brought 9.95 in, nearly three times a normal February.
Most flood policies start 30 days after you buy, and home and renters policies don’t cover flood. The federal program can sell new policies through Dec 11 unless Congress extends it. See the coverage timeline
2015–16 was the strongest El Niño on this index, and Los Angeles got 48% of its normal rain. Prep pays off either way: the same steps protect you from any storm.
Get your ZIP code’s prep plan
One status, one countdown and one next move from the official forecast for your ZIP.
Free · No account · Starting with 95821 (Arden-Arcade, Sacramento)
- What it is
- Three charts of NOAA data: this year’s ocean index against past giants, their rain in Sacramento and Los Angeles, and how a big winter builds.
- Why it’s here
- A possibly record El Niño gives months of warning, and the slow prep jobs only fit before the storms.
- What it helps with
- Seeing what this winter could bring, and why to start on insurance and the slow jobs now.
- How to use it
- Pick a past El Niño to compare, switch cities on the buildup chart, then get your ZIP’s plan.
Why we built Brace For It
This forecast is why Brace For It exists. A possibly historic El Niño gives people something rare: months of warning. Most of that warning gets wasted, because official alerts arrive days before a storm, when the slow jobs can no longer be done.
So we’re building a page for each ZIP code we have real local data for, starting with 95821 in Sacramento: your flood risk, a prep list that starts with the slowest jobs, and a status that changes as storms approach. Watches and Warnings on it come only from the National Weather Service.
El Niño is where we start. Wildfire smoke, extreme heat, hurricanes and power outages come next, so the same page keeps you ready for whatever a less predictable climate brings.
- NOAA CPC: Oceanic Niño Index (charts and the +2.16; the traditional index, with the longest consistent record since 1950)
- NOAA CPC: ENSO diagnostic discussion, Oct 8, 2026 (83% odds; NOAA’s forecasts use its newer relative index)
- KTVU: NOAA’s 2026–27 winter outlook and SnowBrains (outlook issued Oct 15, 2026; California odds by region)
- NOAA ACIS: monthly rain for the Sacramento (SACthr) and downtown Los Angeles (CQTthr) records, water years Oct–Sep; normal = 1991–2020 monthly normals
- NOAA Climate.gov: US El Niño impacts
- Congressional Research Service: NFIP authorized until Dec 11, 2026